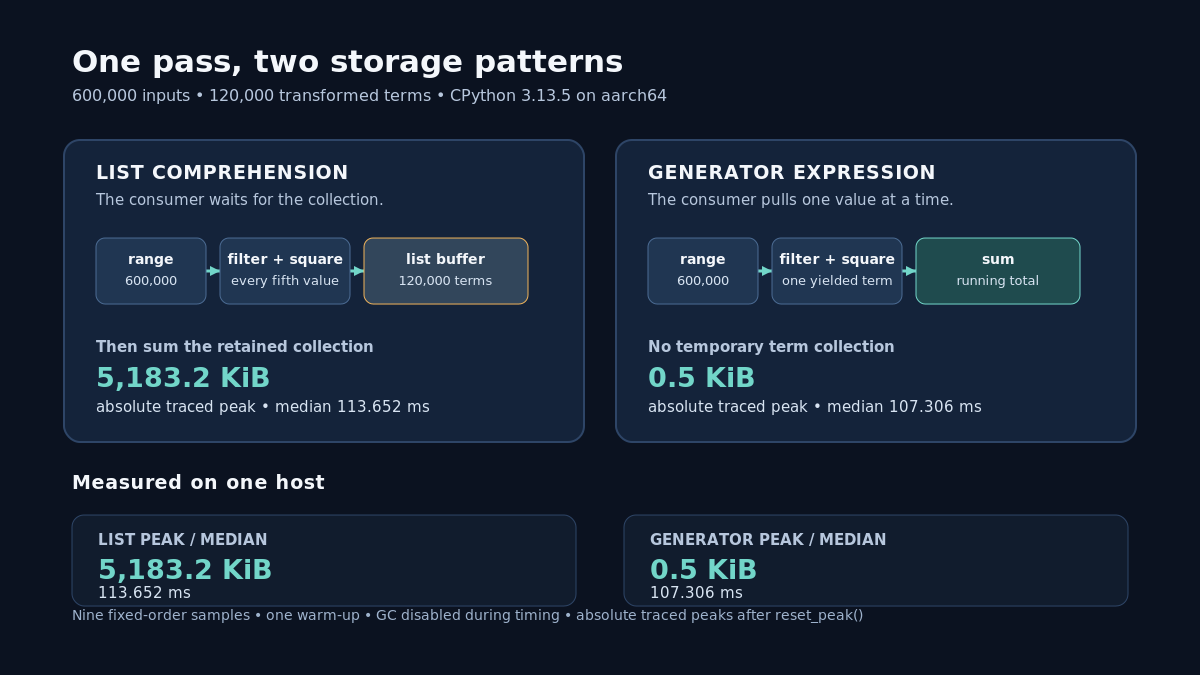
Problem. A one-pass reduction over 600,000 integers needs one final total, while a list comprehension keeps 120,000 transformed terms alive until sum() finishes. Baseline. The list version does O(N) work and retains an O(N) collection of selected terms. Solution. A generator expression gives sum() values as it requests them, so the temporary collection disappears from this pipeline.[1][2] Measured result. On one aarch64 host running CPython 3.13.5, both functions returned the same integer. The displayed traced peaks were 5,183.2 KiB for the list and 0.5 KiB for the generator; the median times were 113.652 ms and 107.306 ms.
Reproduce the result
Complete code
from __future__ import annotationsimport gcimport platformimport statisticsimport sysimport timeimport tracemallocN = 600_000REPEATS = 9WARMUPS = 1def materialised_sum(n: int) -> int: return sum([value * value + 3 for value in range(n) if value % 5 == 0])def generator_sum(n: int) -> int: return sum(value * value + 3 for value in range(n) if value % 5 == 0)def timed_samples() -> dict[str, list[float]]: for function in (materialised_sum, generator_sum): for _ in range(WARMUPS): function(N) was_enabled = gc.isenabled() gc.disable() samples = {"list": [], "generator": []} try: for _ in range(REPEATS): for name, function in ( ("list", materialised_sum), ("generator", generator_sum), ): started = time.perf_counter_ns() function(N) elapsed_ms = (time.perf_counter_ns() - started) / 1_000_000 samples[name].append(elapsed_ms) finally: if was_enabled: gc.enable() return samplesdef peak_memory(function) -> dict[str, float]: gc.collect() tracemalloc.start() try: current_before, _ = tracemalloc.get_traced_memory() tracemalloc.reset_peak() function(N) current_after, peak = tracemalloc.get_traced_memory() finally: tracemalloc.stop() return { "current_before_kib": current_before / 1024, "current_after_kib": current_after / 1024, "peak_kib": peak / 1024, }def generator_reuse_check() -> bool: values = (value for value in range(3)) first = tuple(values) second = tuple(values) return first == (0, 1, 2) and second == ()def main() -> None: expected = materialised_sum(N) observed = generator_sum(N) if expected != observed: raise AssertionError((expected, observed)) if not generator_reuse_check(): raise AssertionError("generator reuse check failed") samples = timed_samples() list_median = statistics.median(samples["list"]) generator_median = statistics.median(samples["generator"]) list_memory = peak_memory(materialised_sum) generator_memory = peak_memory(generator_sum) print("benchmark=generator_pipeline") print(f"python={sys.version.split()[0]}") print(f"platform={platform.platform()}") print(f"machine={platform.machine()}") print(f"input_n={N}") print(f"selected_terms={(N + 4) // 5}") print(f"warmups={WARMUPS}") print(f"repeats={REPEATS}") print("gc_during_timing=disabled") print("correctness=PASS") print("generator_reuse_after_consumption=PASS") print("list_ms=" + ",".join(f"{value:.3f}" for value in samples["list"])) print("generator_ms=" + ",".join(f"{value:.3f}" for value in samples["generator"])) print(f"list_median_ms={list_median:.3f}") print(f"generator_median_ms={generator_median:.3f}") print(f"time_ratio_list_over_generator={list_median / generator_median:.3f}") print(f"list_traced_current_before_kib={list_memory['current_before_kib']:.9f}") print(f"list_traced_current_after_kib={list_memory['current_after_kib']:.9f}") print(f"list_peak_kib_exact={list_memory['peak_kib']:.9f}") print(f"list_peak_kib_display={list_memory['peak_kib']:.1f}") print(f"generator_traced_current_before_kib={generator_memory['current_before_kib']:.9f}") print(f"generator_traced_current_after_kib={generator_memory['current_after_kib']:.9f}") print(f"generator_peak_kib_exact={generator_memory['peak_kib']:.9f}") print(f"generator_peak_kib_display={generator_memory['peak_kib']:.1f}") print(f"peak_ratio_list_over_generator={list_memory['peak_kib'] / generator_memory['peak_kib']:.3f}")if __name__ == "__main__": main()
Exact command
python3 generator_pipeline_benchmark.py
Captured output
$ python3 generator_pipeline_benchmark.pybenchmark=generator_pipelinepython=3.13.5platform=Linux-6.12.47+rpt-rpi-v8-aarch64-with-glibc2.41machine=aarch64input_n=600000selected_terms=120000warmups=1repeats=9gc_during_timing=disabledcorrectness=PASSgenerator_reuse_after_consumption=PASSlist_ms=113.652,113.505,115.298,114.314,113.332,113.146,116.075,113.272,115.647generator_ms=106.392,112.520,107.306,108.529,106.515,107.219,106.575,110.520,108.597list_median_ms=113.652generator_median_ms=107.306time_ratio_list_over_generator=1.059list_traced_current_before_kib=0.000000000list_traced_current_after_kib=0.109375000list_peak_kib_exact=5183.234375000list_peak_kib_display=5183.2generator_traced_current_before_kib=0.000000000generator_traced_current_after_kib=0.054687500generator_peak_kib_exact=0.542968750generator_peak_kib_display=0.5peak_ratio_list_over_generator=9546.101exit=0
Environment
The run used CPython 3.13.5 on Linux 6.12.47+rpt-rpi-v8, aarch64, with the Python standard library only. The platform and machine strings come from platform.platform() and platform.machine(). The retained transcript includes the command, standard output, standard error and exit status. The Python 3.13 documentation links in Sources were retrieved on 2026-10-09.
Methodology
The input is range(600000); every fifth value passes the filter, producing 120,000 terms. Each reduction runs once as a warm-up, then the script records nine timed samples per implementation in a fixed list-then-generator order. The timer uses time.perf_counter_ns(), which the Python 3.13 documentation recommends when avoiding float precision loss.[4]
Automatic cyclic garbage collection is disabled only around the timed loop and restored afterwards. Python’s documentation describes gc.disable() as disabling automatic collection; reference counting still operates.[5]
For each memory run, the script calls gc.collect(), starts tracemalloc, records the traced current size, calls reset_peak(), runs one function, then records the current size and peak before stopping tracing. tracemalloc traces Python memory blocks.[3] The reported peak is the absolute traced peak observed after reset_peak() during that interval. It is not a per-call allocation delta, process RSS figure or complete native-memory footprint. In this run, the traced current size before both calls was 0.000000000 KiB.
The script also consumes one generator object twice. The first tuple contains three values and the second is empty, which records the single-pass boundary in the captured output. Evaluating a new generator expression creates a new generator object, so it can be consumed independently; reusing the already exhausted object yields no second tuple.[2][6] Python’s iterator protocol requires subsequent __next__() calls to keep raising StopIteration after exhaustion.[6]
Limits of the experiment
This is one input shape, one CPython build and one ARM host. The nine timing samples are one fixed-order run with no process isolation, CPU-affinity policy, load control or uncertainty estimate. A repeat on the same machine can change the timing ratio, so 1.059 is a description of this run rather than a portable speed ranking.
The memory result is a tracemalloc measurement. It excludes process RSS, native allocations, interpreter startup, imports and allocator state outside the traced interval. The correctness check compares the two final sums, so it does not inspect every intermediate value independently. The benchmark does not cover PyPy, other Python releases, I/O-bound sources, cyclic object graphs or repeated consumers.
The problem
The baseline is sum([value * value + 3 for value in range(n) if value % 5 == 0]). The brackets ask Python to build a list. The Python 3.13 tutorial describes list comprehensions as a way to create lists and select or transform items from an iterable.[1]
That storage is useful when later code needs indexing, inspection or another pass. It is unnecessary when sum() is the only consumer. The calculation has one result, while the baseline keeps every selected result reachable until the reduction ends.
Baseline complexity
Both implementations inspect N input values, so both do O(N) filtering and arithmetic. In the measured CPython implementation, the list path retains a slot and an integer object for each selected term until sum() has consumed the list. That collection grows with the number of selected terms.
Big-O notation does not predict the measured 5,183.234375 KiB. The exact figure comes from this interpreter, this integer transform and this allocator state. The experiment measures the result rather than treating the complexity label as a memory size.
The solution
The replacement uses parentheses: sum(value * value + 3 for value in range(n) if value % 5 == 0). The Python 3.13 language reference says that a generator expression yields a new generator object and evaluates its variables lazily.[2]
sum() asks for the next value, adds it to its running total and asks again. The transformed values do not accumulate in a second container in this one-pass call. The generator still has execution state and the reduction still has a running total, so the result is a smaller traced peak for this pipeline rather than a claim of zero memory use.
What the measurement shows
The correctness check passed before timing, and the generator reuse check passed before the samples were collected. Both reductions returned the same integer for the 600,000-value input. The generator median was 107.306 ms; the list median was 113.652 ms, giving a list-over-generator ratio of 1.059 in this run.
The output prints exact memory values as well as one-decimal display values. The list peak was 5,183.234375000 KiB and the generator peak was 0.542968750 KiB. Their ratio was 9,546.101. A reader can recompute that ratio from the values in the Output block without recovering hidden floats.
The current traced size before each call was 0.000000000 KiB, and the current size after the calls was 0.109375000 KiB for the list and 0.054687500 KiB for the generator. Those fields make the measurement boundary visible. tracemalloc supplies the traced Python-memory view; it does not report resident pages or native allocations.[3]
Practical applications
A file aggregate is a direct fit. A parser can yield one converted record at a time to sum(), max() or a counter instead of building a second list of every converted value. This benchmark measured arithmetic over range, so file I/O, parsing and operating-system buffering need separate tests.
Telemetry and batch metrics can use the same shape when each sample feeds one reduction. A generator can filter invalid readings and convert units before a total or count. It does not provide a queue, network back-pressure or a bound on memory held by the source itself.
Validation and ETL pipelines can chain a filter and a transformation before one consumer. This removes an intermediate collection when records flow once from input to output. If several consumers need the same transformed values, a list may be clearer and faster when reuse avoids repeating an expensive parse or calculation.
Command-line data tools can use the pattern when they need one answer from a large stream, such as a total, a maximum or whether any record matches a condition. The consumer determines the trade-off: one pass favours an iterator, while random access and repeated traversal favour materialised data. Reusing the same generator object after exhaustion produces no second set of values, as the executable boundary check shows.[6]
Where it stops helping
A generator is the wrong shape when later operations need indexing, sorting, length without consuming the input or several independent passes. It can also make debugging less convenient because the values do not exist as a collection to inspect. A list may be the better choice when memory is available and reuse avoids repeating expensive parsing or computation.
The benchmark supports one narrow decision. For this one-pass arithmetic reduction on this CPython host, the generator avoided the measured temporary list and produced a lower traced peak. The speed result is descriptive, the memory result belongs to tracemalloc, and neither result establishes behaviour on another interpreter, host or workload.
Sources
[1] Python 3.13 data structures tutorial: list comprehensions
[2] Python 3.13 language reference: expressions
[3] Python 3.13 tracemalloc documentation
[4] Python 3.13 time.perf_counter_ns documentation

